Tuesday

1988-1989 Mt. Tihia/ Tokaanu quakes

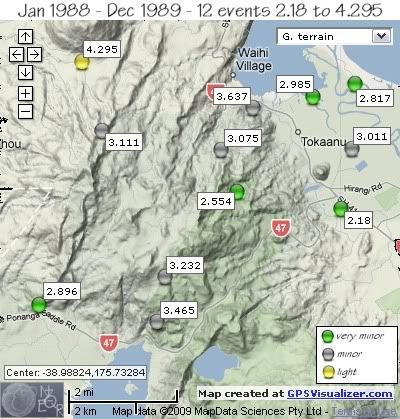
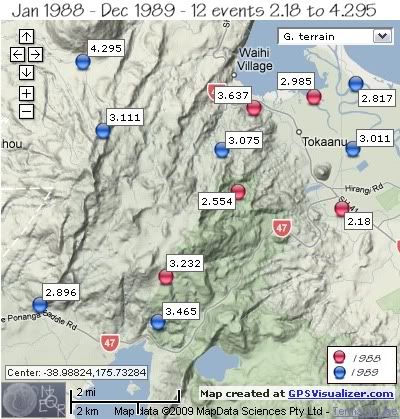
From January 1st 1988 to December 31st 1989 there were 12 earthquake events in the Mt. Tihia/Tokaanu area , 7 of them deeper than 156km.
Apart from two events on October 25th 1989, 20 minutes apart, the rest were scattered both on location and dates.
In 1988 the 5 earthquakes were on the Mt.Tihia side of the area, whereas in 1989 the 7 quakes were widespread. The largest quake in 2 years was the 4.295ML, located 80km deep at the base of Mt. Kuharua.
1988
REF. LAT, LONG, TIME, DEPTH, MAG
8460, -39.00349, 175.72081, 1988/02/02 04:30:50.6, 156, 3.232
25161, -38.95543, 175.77148, 1988/09/19 03:56:06.9, 179, 2.985
30178, -38.98078, 175.74553, 1988/11/17 16:44:43.2, 26, 2.554
30232, -38.95839, 175.75116, 1988/11/20 09:53:25.8, 224, 3.637
33410, -38.98523, 175.7814, 1988/12/23 12:40:59.3, 7, 2.18


1989
REF. LAT, LONG, TIME, DEPTH, MAG
36900, -38.96439, 175.6992, 1989/01/25 05:30:40.3, 183, 3.111
41438, -38.96921, 175.78511, 1989/03/13 12:09:37.4, 183, 3.011
64645, -38.94605, 175.69234, 1989/08/21 06:04:27.7, 80, 4.295
65783, -38.96951, 175.73994, 1989/08/27 20:15:20.1, 191, 3.075
70295, -38.95188, 175.78622, 1989/09/11 20:40:17.6, 179, 2.817
77202, -39.01096, 175.67767, 1989/10/25 01:31:17.1, 5, 2.896
77204, -39.01538, 175.71811, 1989/10/25 01:51:14.3, 5, 3.465


 Mt. Tihia/Tokaanu quakes 1988-1989

 Mt. Tihia/Tokaanu quakes 1988-1989 by year

data by geonet. map by google maps. plots by highace using GPS Visualizer

Monday

1987 Mt. Tihia/ Tokaanu quakes

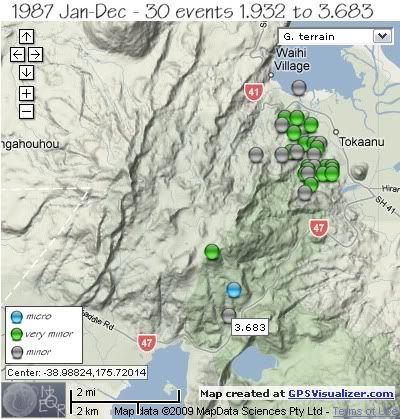
1987 has 6 events shown in the NZ Earthquake Catalogue, as follows;
REF, LAT, LONG, TIME, DEPTH, MAG
3886, -39.00062, 175.7141, 1987/01/27 20:29:52.1, 13, 3.324 *
3748, -38.9565, 175.73206, 1987/01/28 00:00:32.9, 12, 3.622 *
51330, -38.99681, 175.72377, 1987/05/20 02:18:01.2, 5, 2.432
51616, -39.0068, 175.73149, 1987/05/20 02:35:45.7, 2, 1.932
80581, -39.01381, 175.72992, 1987/10/14 10:35:20.3, 127, 3.683
94209, -38.95294, 175.75381, 1987/12/17 04:14:19.7, 5, 3.428


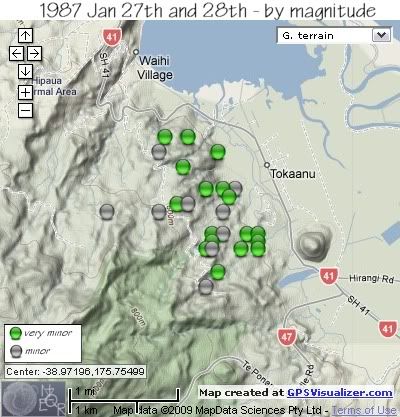
The following map and data on a swarm in 1987 is taken from a paper presented by Steven Sherburn and published in the New Zealand Journal of Geology and Geophysics 1993 Vol 36:61-68, entitled “The 1987 January Tokaanu earthquake sequence, New Zealand”.

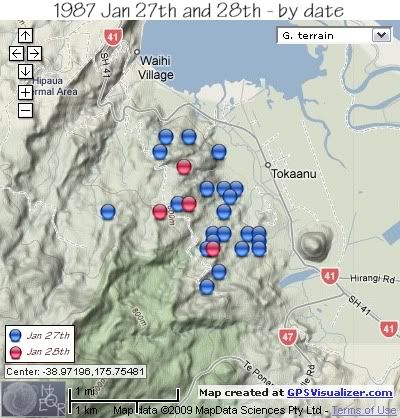
"The 1987 Tokaanu earthquake sequence started at 1987 Jan 27 1923 UTC, and continued until Jan 28 0215 UTC, a duration of almost 7 hours. The largest earthquake in the sequence was 3.6ML Sixty-four earthquakes were recorded on the nearest seismograph during the sequence, and 26 of these were located (shown on maps below). The epicentres were centred 1-2 km northwest of the Tokaanu Power Station, at the northeastern foot of Kakaramea, and about 1-2 km east of the Waihi Fault "

The digital data used in this study come from the Taupo Seismic Network. The nearest seismograph was 12 km away from the centre of the sequence.
Details of the 28 earthquakes from the Tokaanu sequence for which digital waveform data were available.
Earthquakes numbered 4 and 9 were not located.
Those marked with an asterisk are a close match to those on the NZ Catalogue based on the size and approx. time, although the exact depth and location are slightly different.
REF, LAT, LONG, TIME, DEPTH, MAG
1, -38.975, 175.757, 1987/01/27 19:25:28.2, 5, 2.7
2, -38.979, 175.758, 1987/01/27 19:26:35.0, 5, 2.7
3, -38.974, 175.763, 1987/01/27 19:28:45.3, 5, 2.7
4, unlocated, 1987/01/27 19:29:00.0, , 2.5
5, -38.974, 175.765, 1987/01/27 19:30:58.6, 5, 2.8
6, -38.974, 175.757, 1987/01/27 19:32:15.4, 7.7, 2.7
7, -38.968, 175.761, 1987/01/27 19:35:37.9, 5, 3.1
8, -38.976, 175.756, 1987/01/27 19:45:12.9, 5, 2.8
4, unlocated, 1987/01/27 19:46:00.0, , 2.9
10, -38.971, 175.739, 1987/01/27 20:04:54.8, 5, 3.2
11, -38.961, 175.753, 1987/01/27 20:06:09.6, 5, 2.5
12, -38.975, 175.765, 1987/01/27 20:07:08.6, 5, 2.6
13, -38.969, 175.760, 1987/01/27 20:07:35.1, 3.2, 2.4
14, -38.976, 175.765, 1987/01/27 20:08:49.1, 5, 2.6
15, -38.963, 175.758, 1987/01/27 20:10:44.9, 5, 2.1
16, -38.968, 175.756, 1987/01/27 20:14:09.6, 3.7, 2.7
17, -38.981, 175.756, 1987/01/27 20:30:07.6, 5, 3.3 *
18, -38.968, 175.759, 1987/01/27 20:31:34.0, 3.6, 2.7
19, -38.976, 175.762, 1987/01/27 20:31:42.6, 5, 2.1
20, -38.961, 175.749, 1987/01/27 21:13:03.7, 5, 2.3
21, -38.971, 175.759, 1987/01/27 21:17:25.0, 5, 3.2
22, -38.974, 175.759, 1987/01/27 21:19:04.7, 4.6, 3.3
23, -38.970, 175.751, 1987/01/27 21:22:03.7, 5, 2.2
24, -38.963, 175.748, 1987/01/27 21:23:07.6, 7.2, 3.2
25, -38.970, 175.753, 1987/01/28 00:00:49.7, 5, 3.6
26, -38.965, 175.752, 1987/01/28 00:07:49.0, 5, 2.3 *
27, -38.976, 175.757, 1987/01/28 00:14:30.1, 5, 3.2
28, -38.971, 175.748, 1987/01/28 01:24:23.0, 5, 3.2


 Mt. Tihia/Tokanaau quakes 1987

 Tokaanu swarm Jan 27th and 28th sorted by magnitude

 Tokaanu swarm Jan 27th and 28th sorted by date

data by geonet. map by google maps. plots by highace using GPS Visualizer

Sunday

1986 Mt. Tihia/ Tokaanu quakes

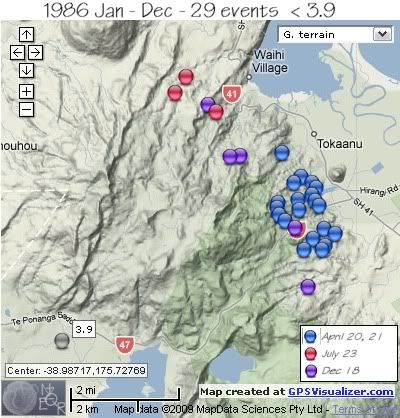
1986 has only one event shown in the NZ Earthquake Catalogue, a 3.9ML on 7th August down in the Lake Rotoaira Valley.
The following map and data on other events in 1986 is taken from a paper presented to the 17th NZ Geothermal Workshop 1995 called “ Earthquake Swarm Activity Beneath Tokaanu-Waihi Geothermal System, Lake Taupo, New Zealand” researched by M..P. Hochstein, S. Sherburn and J. Tikku. Geothermal Institute and Geology Department, University of Auckland, NZ, IGNS Wairakei, NZ
There are no co-ordinates for the epicenters of the quakes available, so the map and co-ordinates have been created by hand from a sketch map within the above report and match to the original map as close as possible. The epicenters were computed using the iterative Geiger method and the original digital data recorded by the Taupo Seismic Network., a network of six telemetred seismographs that operated around Lake Taupo between 1985 September and 1991 July.

All epicentres are located inside the low resistivity structure which outlines hot and thermally altered rocks in the upper 0.5 km of the Tokaanu-Waihi geothermal reservoir.
There is no data available on the magnitudes save for the maximum size in each swarm.
The April 20th-21st swarm had a sequence of 20 events. The maximum magnitude of 16 events on the 20th was 3.1 and the sequence lasted 1 hour. The later part of the swarm on the 21st had 4 events over a period of 6.5 hours.
The 3 events of the small July 23rd swarm occurred close to the thermally active Hipaua area, the 3 events occurred over a period of 1.5 hrs and the largest event was 2.6ML.
The 18th December swarm of 5 events was over a period of 10 hours and the largest quake was a 2.1ML.

The locations are marked on the map below, the dates shown by colour.
 Mt. Tihia/Tokaanu quakes 1986

data by geonet. map by google maps. plots by highace using GPS Visualizer

Saturday

1985 Mt. Tihia/ Tokaanu quakes

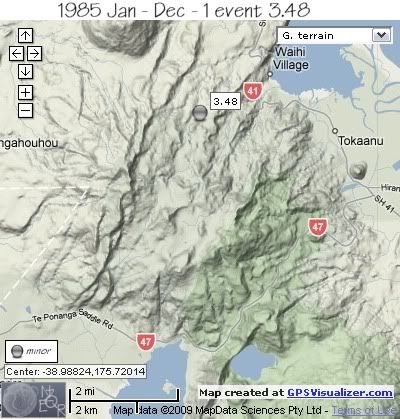
Only 1 event in the Mt. Tihia/Tokaanu area in 1985, a 3.48ML located west of the Hipaua Thermal Area on the 12th January.
 Mt. Tihia/Tokanaau quakes 1985
REF, LAT, LONG, TIME, DEPTH, MAG
1566657, -38.96, 175.72, 1985/01/12 09:48:19.0, 4, 3.48


data by geonet. map by google maps. plots by highace using GPS Visualizer

Friday

1984 Mt. Tihia/ Tokaanu quakes

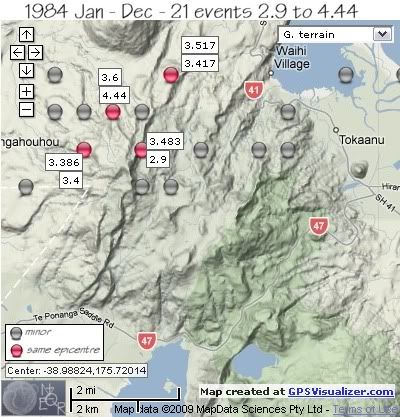
In 1984 there were 21 earthquakes in the Mt. Tihia/Tokaanu area.
There were 3 series of events of note, 6th March, 13th – 14th April and 25th-26th August.
 Mt. Tihia/Tokanaau quakes 1984

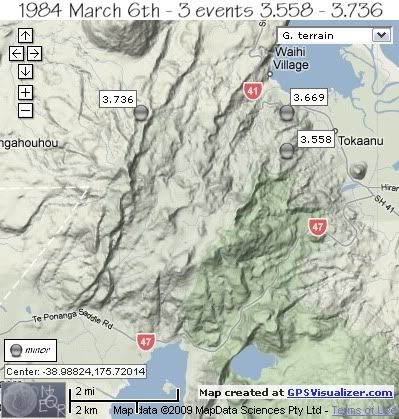
The first sequence of 1984 was on 6th March with 3 minor events within 49 minutes of each other, the first quake under the northern foothills of Mt. Tihia NW of Tokaanu, the 2nd quake further to the west under Mt. Kakaramea just west of the Waihi River and the 3rd quake back under the Mt. Tihia foothills, south of the first quake.
REF, LAT, LONG, TIME, DEPTH, MAG
1565057, -38.96, 175.75, 1984/03/06 05:01:50.2, 1, 3.669
1565059, -38.96, 175.7, 1984/03/06 05:11:01.0, 6, 3.736
1565061, -38.97, 175.75, 1984/03/06 05:50:07.7, 1, 3.558

 Mt. Tihia/Tokanaau quakes March 6th 1984

two further minor quakes in March and early April;
REF, LAT, LONG, TIME, DEPTH, MAG
1565072, -38.95, 175.67, 1984/03/09 21:54:08.7, 10, 3.717
1565146, -38.97, 175.74001, 1984/04/03 09:55:58.7, 5, 3.236


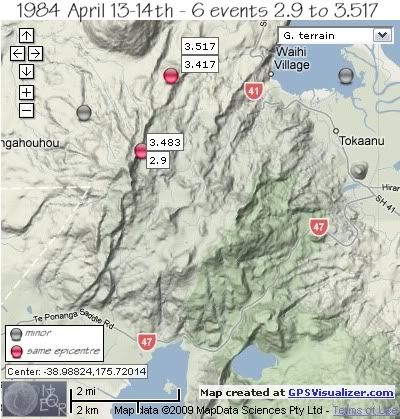
Swarm of 13th –14th April started on the 13th April with 2 quakes at the same location 45 seconds apart, SE of Mt. Kuharua, followed by another 15 hrs later under the summit of Mt. Kakaramea of 3.483ML.
It was another 9hrs before the next earthquake to the west of Mt. Kakaramea, followed by a 3.45ML in Tokaanu Bay and finished with a 2.9ML back at the location of the 3.483ML.
REF, LAT, LONG, TIME, DEPTH, MAG
1565184, -38.95, 175.71001, 1984/04/13 01:34:31.6, 6, 3.417
1565185, -38.95, 175.71001, 1984/04/13 01:35:16.4, 5, 3.517
1565189, -38.97, 175.7, 1984/04/13 16:49:58.7, 2, 3.483
1565191, -38.96, 175.67999, 1984/04/14 02:08:01.2, 5, 3.225
1565192, -38.95, 175.77, 1984/04/14 08:52:54.0, 2, 3.45
1565194, -38.97, 175.7, 1984/04/14 09:20:25.1, 5, 2.9

 Mt. Tihia/Tokanaau quakes April13-14th 1984

One quake located on the north side of Tongariro River Delta on the 15th, not part of either swarm.
1565197, -38.95, 175.78999, 1984/04/15 00:49:37.6, 5, 3.46


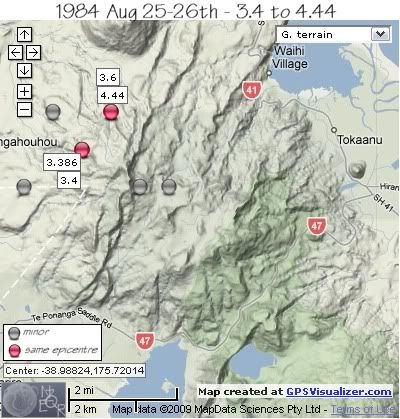
The swarm of 25th –26th August to the NW of Mt.Tihia, started with an isolated 3.888ML in the western foothills of Mt. Kakaramea, followed by a 3.7ML 2.2km to the NNE 2 ¼ hrs later. 33 seconds later the largest quake of 1984 ( the 4.44ML) hit, 2km east.
It was another 4 hrs before the 3.4ML, 2km south of the previous 3 events, followed 1 ½ hrs later by a 3.386ML at the same location.
The swarm finished rapidly, with 3 events within 3 minutes, 2 to the east of Mt.Kakaramea summit and one back at the same location as the 4.44ML.
REF, LAT, LONG, TIME, DEPTH, MAG
1565566, -38.98, 175.66, 1984/08/25 20:32:01.1, 5, 3.888
1565567, -38.96, 175.67, 1984/08/25 22:48:11.6, 5, 3.7
1565568, -38.96, 175.69, 1984/08/25 22:48:44.4, 5, 4.44
1565569, -38.97, 175.67999, 1984/08/26 03:55:57.4, 5, 3.4
1565570, -38.97, 175.67999, 1984/08/26 05:39:28.0, 5, 3.386
1565571, -38.98, 175.7, 1984/08/26 05:44:13.7, 5, 3.567
1565572, -38.96, 175.69, 1984/08/26 05:45:35.8, 5, 3.6
1565573, -38.98, 175.71001, 1984/08/26 05:46:04.6, 5, 3.82

 Mt. Tihia/Tokanaau quakes August 25-26th 1984

The year finished with one other event in December, 1km NNW of Mt. Tihia summit.;
REF, LAT, LONG, TIME, DEPTH, MAG
1565841, -38.97, 175.72, 1984/12/03 17:15:09.7, 11, 3.418


data by geonet. map by google maps. plots by highace using GPS Visualizer

Thursday

1983 Mt.Tihia/Tokaanu quakes

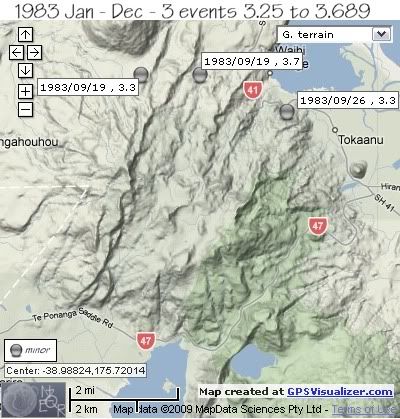
Between 1974 and 1983 there are no records of events in the area. In 1983 there were only 3 earthquakes, all in the northern area and all in September. Two quakes on the 19th September. one at the base of Mt. Kuharua, and the other near the Waihia River. The other quake , on 26th September was under the northern foothills of Mt. Tihia west of Tokaanu.
 Mt. Tihia/Tokaanu quakes 1983

REF, LAT, LONG, TIME, DEPTH, MAG
1564528, -38.95, 175.7, 1983/09/19 10:16:45.0, 12, 3.25
1564530, -38.95, 175.72, 1983/09/19 17:45:01.9, 12, 3.689
1564544, -38.96, 175.75, 1983/09/26 18:17:18.0, 12, 3.344


data by geonet. map by google maps. plots by highace using GPS Visualizer

Wednesday

1968-1974 Mt. Tihia/Tokaanu quakes

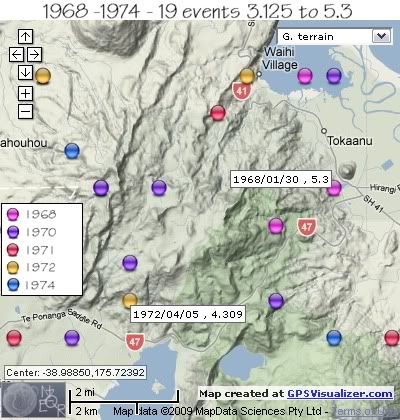
From 1968 to 1974 there were 19 earthquakes in the Mt.Tihia/Tokaanu area.
The largest quake was a 5.3ML on the 30th January 1968 in between the NE base of Mt. Tihia and Maunganamu Cone south of Tokaanu.
The next largest , and deepest quake was a 4.309ML on April 5th 1972 located on the southern flank of Mt. Tihia at 109km deep.
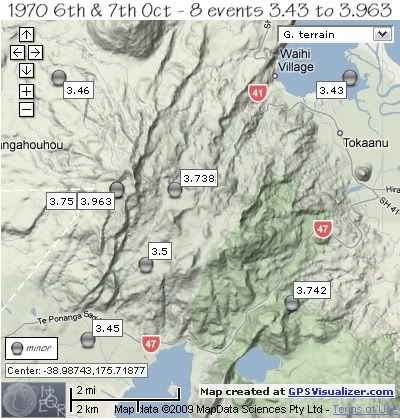
The only significant swarm during the 6 year period was a 8 event swarm in 1970 on the 6th and 7th October.
 Mt. Tihia/Tokanaau quakes 1968-1974 by location and year

REF, LAT, LONG, TIME, DEPTH, MAG
1549977, -38.98, 175.77, 1968/01/30 05:38:54.2, 12, 5.3
1549978, -38.99, 175.75, 1968/01/30 05:42:17.3, 12, 3.5
1550009, -38.95, 175.75999, 1968/02/18 15:05:22.0, 12, 3.538


The 1970 swarm of October 6th and 7th was widespread across the area but all within 6-7km of the center point of Mt. Tihia summit.
* same location
1553148, -39.02, 175.67999, 1970/10/06 00:55:33.2, 12, 3.45
1553149, -38.98, 175.69, 1970/10/06 02:42:26.3, 12, 3.75 *
1553153, -39, 175.7, 1970/10/06 03:38:42.7, 12, 3.5
1553155, -38.95, 175.77, 1970/10/06 09:11:00.2, 12, 3.43
1553157, -38.98, 175.69, 1970/10/06 15:56:53.2, 12, 3.963 *
1553158, -39.01, 175.75, 1970/10/06 16:01:18.4, 12, 3.742
1553162, -38.95, 175.67, 1970/10/07 00:12:02.1, 12, 3.46
1553168, -38.98, 175.71001, 1970/10/07 16:03:17.3, 12, 3.738

 Mt. Tihia/Tokanaau quakes 1970 by magnitude

Other quakes 1971 to 1974;
REF, LAT, LONG, TIME, DEPTH, MAG
1553414, -38.96, 175.73, 1971/02/10 06:12:56.6, 12, 3.711
1553418, -39.02, 175.78999, 1971/02/10 22:22:16.2, 12, 3.65
1553850, -39.02, 175.66, 1971/09/18 21:26:37.9, 12, 3.5
1554206, -39.01, 175.7, 1972/04/05 18:29:18.9, 109, 4.309
1554636, -38.95, 175.67, 1972/12/02 15:43:05.4, 12, 3.627
1554644, -38.95, 175.74001, 1972/12/07 22:52:55.3, 12, 3.125
1555487, -38.97, 175.67999, 1974/01/27 18:06:40.0, 12, 3.979
1555488, -39.02, 175.77, 1974/01/27 21:57:03.5, 12, 3.985


data by geonet. map by google maps. plots by highace using GPS Visualizer

Tuesday

1967 Mt. Tihia/Tokaanu quakes

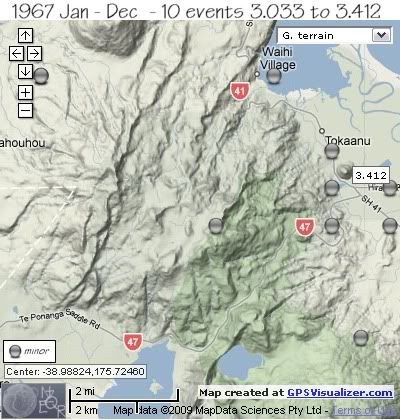
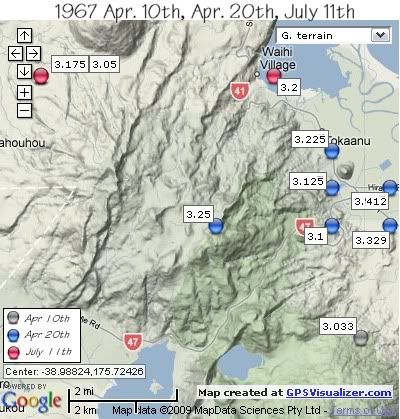
1967 was the first year when swarms were recorded in the Mt. Tihia/ Tokaanu area. There were essentially two sequences during 1967, the 1st with 6 events on April 20th under the NE base of Mt.Tihia south of Tokaanu, and one event centred under the summit of Mt.Tihia. The 2nd sequence of 3 events was on July 11th with 2 events located SW of Mt. Kuharua and 1 event in Waihi Bay, Lake Taupo off Waihi Village.
The other quake of 1967 was located under the lower NE slopes of Mt. Pihanga
The map below shows the locations;
 Mt. Tihia/Tokanaau quakes 1967 by magnitude

REF, LAT, LONG, TIME, DEPTH, MAG
* same location
1549534, -39.02, 175.78, 1967/04/10 14:36:26.3, 12, 3.033
1549547, -38.99, 175.78999, 1967/04/20 04:44:45.2, 12, 3.329
1549549, -38.99, 175.77, 1967/04/20 04:49:02.9, 12, 3.1
1549552, -38.98, 175.78999, 1967/04/20 05:56:24.9, 12, 3.412
1549553, -38.98, 175.77, 1967/04/20 06:04:20.6, 12, 3.125
1549555, -38.97, 175.77, 1967/04/20 07:22:31.6, 12, 3.225
1549556, -38.99, 175.73, 1967/04/20 08:07:57.0, 12, 3.25
1549671, -38.95, 175.67, 1967/07/11 06:22:55.9, 12, 3.05 *
1549673, -38.95, 175.67, 1967/07/11 08:19:53.0, 12, 3.175 *
1549674, -38.95, 175.75, 1967/07/11 08:54:44.0, 12, 3.2


The map below shows the same events separated by date
( colour of orbs denotes dates as per key on map)
 Mt. Tihia/Tokanaau quakes 1967 by date

data by geonet. map by google maps. plots by highace using GPS Visualizer

Monday

1941-1965 Mt. Tihia/Tokaanu quakes

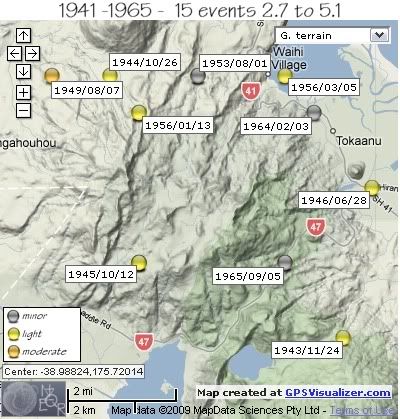
From 1941 to 1965 there were 15 earthquakes recorded within the study/search area of Mt. Tihia/ Tokaanu. The largest and deepest earthquake during the 24 year period was a 5.1 on the 7th August 1949 located SW of Mt. Kuharua.
The map below shows the locations and dates of the events, the colour of the orbs show the magnitude range (see key on map)

 Mt. Tihia/Tokanaau quakes 1941-1965

REF, LAT, LONG, TIME, DEPTH, MAG
* same location
2178505, -39, 175.7, 1941/05/30 06:05:06.0, , 3.7 *
2178506, -39, 175.7, 1941/05/30 18:54:32.0, , 2.7 *
1585334, -39, 175.75, 1942/04/30 09:09:42.4, 12, 4
1542420, -39.02, 175.77, 1943/11/24 14:28:35.0, 115, 4.25
1542569, -38.95, 175.69, 1944/10/26 21:29:36.5, 163, 4.85
1542698, -39, 175.7, 1945/10/12 04:18:38.9, 12, 4.2 *
1542802, -38.96, 175.7, 1946/05/22 18:05:24.2, 12, 4.1
1542848, -38.98, 175.78, 1946/06/28 11:50:20.0, 12, 4.333
1543568, -38.95, 175.72, 1949/07/19 17:07:16.6, 182, 4.55
1543584, -38.95, 175.67, 1949/08/07 22:10:05.0, 182, 5.1
1544767, -38.95, 175.72, 1953/08/01 11:52:12.0, 12, 3.7
1545358, -38.96, 175.7, 1956/01/13 07:18:34.9, 33, 4.175
1545397, -38.95, 175.75, 1956/03/05 01:21:43.7, 12, 4.1
1547739, -38.96, 175.75999, 1964/02/03 18:48:02.1, 12, 3.2
1548702, -39, 175.75, 1965/09/05 21:50:19.5, 119, 3.54


data by geonet. map by google maps. plots by highace using GPS Visualizer

Sunday

Rotoaira/Rotopounamu Introduction

The parameters of Latitude and Longitude that have been used in this research/study have been set by the earthquake swarm events of 30 May to 2nd June 2009. They are Northern Latitude -39.015 (39° 0' 54" S), Southern Latitude -39.06 (-39° 3' 36" S), Western Latitude 175.66 (175° 39' 35.9994" E), Eastern Latitude 175.79 (175° 47' 23.9994" E).
Whilst there were earthquakes outside this study area during the same periods of time, I have kept to the perameters which cover the Western and Upper reaches of Lake Rotoaira, across the Ponanga Saddle between Lake Rotopounamu and Mt Tihia, to Mt Pihanga in the east for clarity.
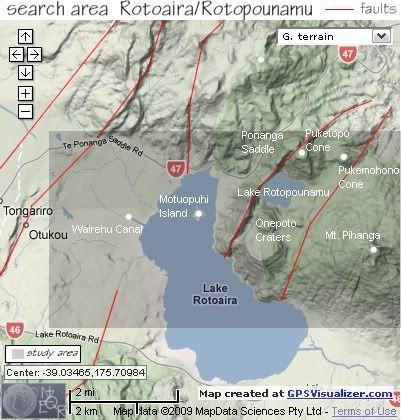
The maps below show the search areas as a darker shade.

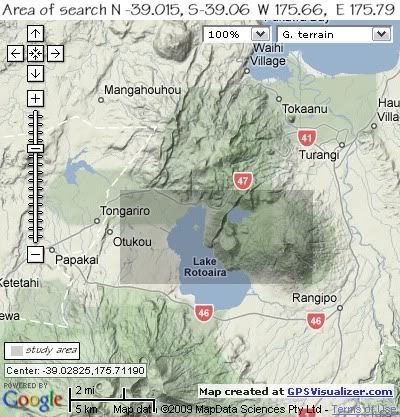
 area that the maps cover

 area of search

 area of search with geographical tags

Geography.
The Tongariro Volcanic Centre occupies the southern 65km of the Taupo Volcanic Zone and comprises three main volcanic complexes. In the north, the large cones of Pihanga (1,304m), Kakaramea (1,280m) and Tihia (1,147m) and smaller cones Puketopo (930m) and Pukemohono (795m) within what is known as the Rotopounamu Graben, all are extinct and are aligned NW-SE for about 10km.
The Rotopounamu Graben was formed approx. 2000 years ago after major eruptive acticity on the Tongariro Massif ceased. There are two un-named fault lines of uncertain age that run NNE-SSW on the east and west sides of Lake Rotopounamu. The lake may be consequent on ponding of drainage and so post date the faulting or it may have been an explosion crater.
Lake Rotopounamu is approx 1m2 in area and with a maximum depth of 7.5m.
South of Lake Rotopounamu are two un-named cones known as Onepoto Craters, a minimum age of 20,000 years is suggested for all cones and domes in the Rotopounamu Graben area.

Deformation of the southern part of the Taupo Volcanic Zone in repect to the Kaimanawa Range to the east is estimated at an average rate of 2.1metres per thousand years.
Recent scientific work indicates that the earth's crust below the Taupo Volcanic Zone may be as little as 16 kilometres thick. A film of Magma 50 kilometres (30 mi) wide and 160 kilometres (100 mi) long lies 10 kilometres under the surface.
Local deformation within the Rotoaira/Rotopounamu Graben is known in historic times. Hochstetter’s 1864 sketch map of Lake Rotoaira shows two peninsulas extending into the lake, one at the southestern end and another at the northwestern end connecting with Motuopuhi Island.
In 1933 Grange and Williamson published a map of the area and the southeastern peninsula had disappeared but the northwestern peninsula persisted.
Since 1973 the end of the northwestern peninsula has become separated to form Motuopuhi Island. The area of Lake Rotoaira is therefore gradually extending as this part of the graben becomes further depressed.
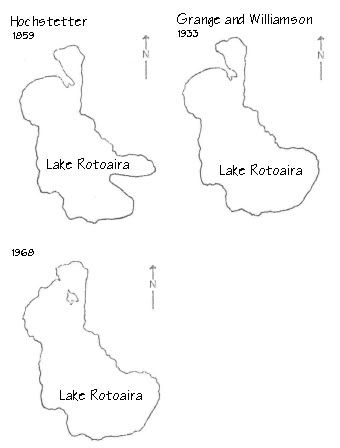
 150 years of Lake Rotoaira deformation maps

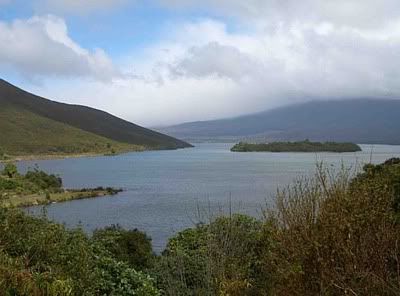
 Rotoaira from Tongariro Crossing trail

  Lake Rotopounamu from the air. Pic by ColinM
 view over Lake Rotoaira and Motuopuhi Island from the north. Pic by Bertu Burma

Saturday

Rotoaira/Rotoponamu Quake Chart

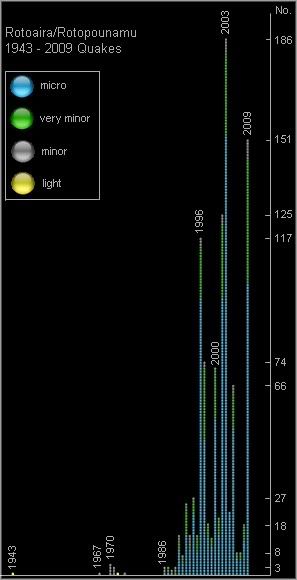
The bar chart below plots by year, all the earthquakes on the NZ Earthquake Catalogue held by Geonet for the years 1943 through to 2009, in the study/search area marked in the maps.
I acknowledge the New Zealand GeoNet project and its sponsors EQC, GNS Science and LINZ, for providing data used in this study.
 chart showing number of earthquakes per year 1943 to 1009 in the Rotoaira/Rotopounamu area

graph/plots by highace.

Friday

Lake Rotoaira Swarm Nov 21st 2009

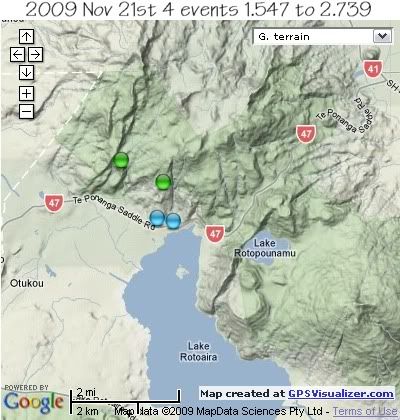
Continuation of swarm of 20th November, similar pattern with two micro quakes at the base of Mt. Tihia and two very minor-quakes up higher on the south western slopes.

 micro swarm Lake Rotoaira Area Nov 21st 2009

REF, LAT, LONG, TIME, DEPTH, MAG

3187077, -39.0194, 175.7065, 2009/11/21 09:48:49.8, 5, 1.878
3187091, -39.0186, 175.701, 2009/11/21 10:22:48.9, 5, 1.547
3187166, -39.009, 175.7028, 2009/11/21 13:26:33.0, 5, 2.793
3187167, -39.0033, 175.6885, 2009/11/21 13:29:10.3, 2, 2.465


data by geonet. map by google maps. plots by highace using GPS Visualizer

Lake Rotoaira Swarm Nov 20th 2009

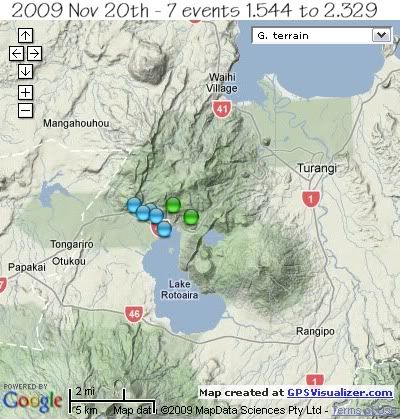
Small 7 event swarm with 2 very-minor events an hour apart at Sat 1:415am and 2:44am NZDT in the southern foothills of Mt. Tihia, then a series of 5 events between 9:18 am and 10:01am more to the west south west.
 micro swarm Lake Rotoaira Area Nov 20th 2009

REF, LAT, LONG, TIME, DEPTH, MAG

3186643, -39.01523, 175.72263, 2009/11/20 12:41:35.9, 5, 2.057
3186662, -39.00906, 175.71051, 2009/11/20 13:44:37.7, 5, 2.329
3186784, -39.015, 175.69855, 2009/11/20 20:18:55.2, 5, 1.84
3186787, -39.01305, 175.68974, 2009/11/20 20:27:27.0, 5, 1.544
3186795, -39.0123, 175.69469, 2009/11/20 20:53:11.8, 5, 1.582
3186796, -39.02209, 175.70459, 2009/11/20 20:56:23.9, 5, 1.88
3186797, -39.00916, 175.68362, 2009/11/20 21:01:04.9, 6, 1.586


data by geonet. map by google maps. plots by highace using GPS Visualizer

Thursday

Lake Rotoaira Area Sept 21st 2009

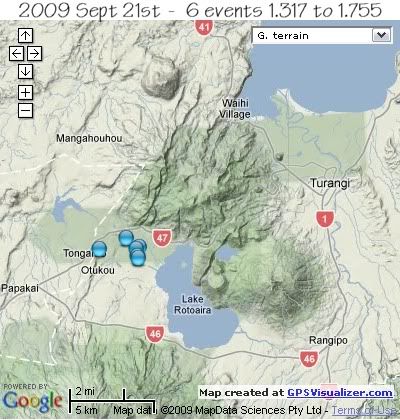
Small micro swarm over a period of 5 hours September 21st 2009 to the north west of Lake Rotoaira
 micro swarm Lake Rotoaira Area Sept 21st 2009

REF, LAT, LONG, TIME, DEPTH, MAG
3157261, -39.02364, 175.67839, 2009/09/21 14:16:43.4, 8, 1.576
3157263, -39.01843, 175.66907, 2009/09/21 14:20:16.8, 9, 1.546
3157330, -39.02441, 175.67648, 2009/09/21 18:00:44.5, 7, 1.366
3157361, -39.0285, 175.67654, 2009/09/21 19:25:07.5, 7, 1.513
3157363, -39.02919, 175.67766, 2009/09/21 19:31:41.3, 13, 1.755
3157366, -39.02467, 175.65073, 2009/09/21 19:43:25.5, 4, 1.317


data by geonet. map by google maps. plots by highace using GPS Visualizer

Wednesday

Lake Rotoaira Swarm May 30th-June 2nd

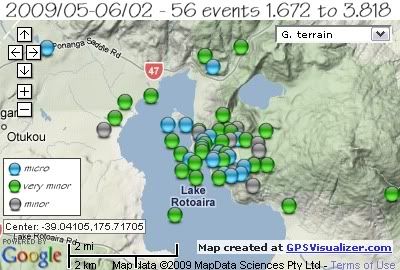
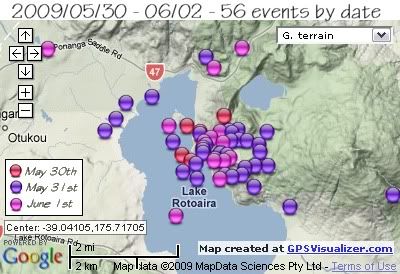
Swarm on the shores of Lake Rotoaira, which is between Lake Taupo and Mount Tongariro. Started on the 30th May and most of the action 31st May UTC but still going on 1st June UTC.
3 of the events have been felt in the Turangi area which is the nearest population centre (pop. 3,500), the largest the 3.782 ML

The map below shows the same events split into date by magnitude (see key on map)
lake rotoaira swarm May/ June 2009 by mag

The map below shows the same events split into date by colour (see key on map)
lake rotoaira swarm May/ June 2009 by date

The Volcano Alerts are normal, Ruapehu still at Alert Level 1 which is standard for an active volcano.
List of 59 events in this swarm;
REF, LAT, LONG, TIME, DEPTH, MAG, FELT
3100075, -39.0431, 175.711, 2009/05/30 15:31:37.6, 1.8, 2.268
3100080, -39.0448, 175.714, 2009/05/30 15:43:08.4, 5.6, 1.894
3100227, -39.0353, 175.7127, 2009/05/30 22:03:54.4, 9.9, 1.935
3100238, -39.0371, 175.7172, 2009/05/30 22:27:33.4, 5.2, 2.546
3100244, -39.0327, 175.7252, 2009/05/30 22:42:10.0, 3.4, 2.442
3100365, -39.0426, 175.7242, 2009/05/31 04:13:52.9, 7.7, 2.11
3100376, -39.0419, 175.7183, 2009/05/31 04:39:16.2, 5.5, 2.917
3100380, -39.0406, 175.7192, 2009/05/31 04:52:01.7, 6.2, 2.666
3100497, -39.0489, 175.728, 2009/05/31 09:56:00.9, 3.5, 1.711
3100501, -39.0429, 175.7239, 2009/05/31 10:04:46.2, 8.3, 1.899
3100514, -39.0516, 175.7355, 2009/05/31 10:33:13.1, 0.5, 3.064
3100518, -39.0461, 175.7405, 2009/05/31 10:39:19.0, 1.7, 2.208
3100521, -39.0293, 175.6915, 2009/05/31 10:46:00.4, 0.0, 2.808
3100529, -39.0364, 175.7302, 2009/05/31 11:02:39.3, 4.5, 3.264
3100531, -39.0335, 175.6883, 2009/05/31 11:05:32.6, 1.8, 2.559
3100533, -39.0424, 175.7376, 2009/05/31 11:08:45.3, 4.5, 3.172, F
3100543, -39.0461, 175.736, 2009/05/31 11:20:18.4, 3.9, 2.171
3100544, -39.0467, 175.7325, 2009/05/31 11:23:39.6, 7.0, 1.893
3100559, -39.0376, 175.7171, 2009/05/31 11:54:09.7, 3.8, 3.258, F
3100572, -39.0484, 175.7257, 2009/05/31 12:26:11.8, 2.4, 1.897
3100617, -39.0427, 175.7182, 2009/05/31 14:26:58.2, 6.0, 2.351
3100619, -39.0394, 175.7278, 2009/05/31 14:31:04.4, 4.6, 3.818
3100627, -39.0444, 175.7223, 2009/05/31 14:31:04.5, 6.2, 3.782, F
3100622, -39.0368, 175.6844, 2009/05/31 14:37:51.0, 5.5, 3.235
3100628, -39.037, 175.7401, 2009/05/31 14:46:43.4, 6.1, 2.049
3100629, -39.0372, 175.7282, 2009/05/31 14:47:58.9, 7.4, 2.139
3100630, -39.0486, 175.7315, 2009/05/31 14:50:14.2, 6.9, 1.725
3100632, -39.017, 175.719, 2009/05/31 14:54:56.3, 11.3, 2.849
3100635, -39.0571, 175.7479, 2009/05/31 15:00:36.2, 2.3, 2.745
3100636, -39.0393, 175.7331, 2009/05/31 15:02:19.5, 3.3, 2.422
3100637, -39.0398, 175.7078, 2009/05/31 15:03:23.1, 6.2, 2.09
3100640, -39.0392, 175.7304, 2009/05/31 15:09:41.5, 4.6, 1.961
3100642, -39.0477, 175.7112, 2009/05/31 15:12:38.0, 4.3, 2.247
3100643, -39.0539, 175.7834, 2009/05/31 15:13:42.9, 12.8, 2.062
3100645, -39.0406, 175.7374, 2009/05/31 15:16:48.4, 6.0, 3.454
3100646, -38.9791, 175.7699, 2009/05/31 15:18:55.7, 0.0, 2.167
3100651, -39.0455, 175.7158, 2009/05/31 15:32:00.7, 6.7, 2.284
3100654, -39.0495, 175.7159, 2009/05/31 15:38:30.9, 3.6, 2.647
3100660, -39.0432, 175.7264, 2009/05/31 15:50:46.1, 5.8, 2.127
3100697, -39.0277, 175.7005, 2009/05/31 17:14:28.0, 7.8, 2.145
3100698, -39.0368, 175.727, 2009/05/31 17:16:49.1, 2.0, 2.839
3100907, -39.044, 175.7272, 2009/06/01 02:19:58.5, 7.4, 1.952
3100912, -39.0448, 175.7254, 2009/06/01 02:34:43.7, 4.3, 2.246
3100915, -39.0595, 175.7087, 2009/06/01 02:39:00.9, 5.0, 2.736
3100917, -39.0496, 175.724, 2009/06/01 02:42:17.7, 5.0, 2.344
3100919, -39.0145, 175.7314, 2009/06/01 02:47:16.6, 8.3, 2.033
3100923, -39.037, 175.7241, 2009/06/01 02:55:55.3, 2.0, 2.388
3100927, -39.0449, 175.7217, 2009/06/01 03:07:26.7, 6.4, 1.862
3100937, -39.02, 175.722, 2009/06/01 03:29:09.8, 10.5, 1.864
3100939, -39.04, 175.7251, 2009/06/01 03:31:54.9, 2.9, 2.611
3100946, -39.0413, 175.7179, 2009/06/01 03:44:47.5, 8.0, 1.854
3100952, -39.0434, 175.7129, 2009/06/01 03:58:14.2, 7.9, 1.92
3100957, -39.0585, 175.7264, 2009/06/01 04:12:45.5, 6.4, 1.874
3101065, -39.0398, 175.7185, 2009/06/01 08:42:10.7, 6.7, 1.81
3101067, -39.0438, 175.7152, 2009/06/01 08:44:47.9, 3.9, 1.672
3101077, -39.0355, 175.7063, 2009/06/01 09:08:35.9, 9.4, 1.859
3101138, -38.574, 175.7121, 2009/06/01 11:34:46.3, 178.7, 3.753
3101155, -39.015, 175.6649, 2009/06/01 12:19:08.1, 2.2, 1.821
3101248, -39.0386, 175.7208, 2009/06/01 16:01:21.6, 5.0, 1.69


data by geonet. map by google maps. plots by highace using GPS Visualizer

Lake Rotoaira Area Jan-May 2009

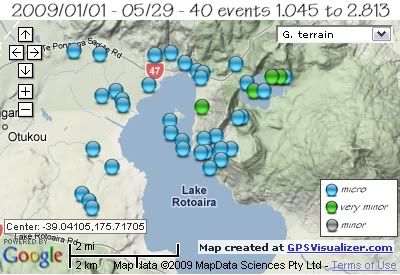
In the period January 1st through to 29th May there were 40 earthquake events in the Lake Rotoaira/Rotopounamu area, with two notable small swarms on the 7th and 15th May, prior to the events of the 30th May/1stJune.

 total 40 quakes Rotoaira/Rotopounamu area Jan 1st to May 29th

List of 40 events Jan 1 to May 29th 2009;
REF, LAT, LONG, TIME, DEPTH, MAG, FELT
3025704, -39.0337, 175.7301, 2009/01/05 05:13:06.2, 5, 1.552
3033503, -39.0576, 175.6799, 2009/01/21 13:07:09.0, 6, 1.756
3033666, -39.0537, 175.6765, 2009/01/21 21:04:13.0, 5, 1.458
3035641, -39.0161, 175.7071, 2009/01/25 13:55:07.7, 5, 1.141
3035577, -39.0167, 175.7015, 2009/01/25 15:00:34.4, 5, 1.211
3035595, -39.0188, 175.7118, 2009/01/25 15:58:10.6, 5, 1.261
3037020, -39.0558, 175.6789, 2009/01/28 09:17:51.1, 6, 1.263
3039998, -39.021, 175.7161, 2009/02/03 07:30:43.2, 5, 1.117
3047910, -39.0289, 175.6901, 2009/02/19 14:18:00.0, 5, 1.394
3052748, -39.0396, 175.7107, 2009/03/01 09:47:42.5, 5, 1.305
3065715, -39.0229, 175.7173, 2009/03/26 14:07:07.1, 9, 1.205
3065720, -39.0334, 175.7315, 2009/03/26 14:22:35.4, 2, 1.182
3065763, -39.0217, 175.7182, 2009/03/26 16:30:49.8, 8, 1.465
3065866, -39.0165, 175.6827, 2009/03/26 20:41:22.1, 5, 1.047
3069562, -39.0467, 175.6867, 2009/04/03 01:58:52.1, 6, 1.704
3070080, -39.0278, 175.6833, 2009/04/04 04:40:14.8, 5, 1.432
3070088, -39.0301, 175.6905, 2009/04/04 05:05:29.8, 5, 1.217
3070095, -39.0265, 175.6882, 2009/04/04 05:23:45.2, 5, 1.474
3071044, -39.0384, 175.7225, 2009/04/04 05:51:32.2, 5, 1.287
3070771, -39.0191, 175.7296, 2009/04/05 14:54:39.6, 7, 1.438
3076983, -39.042, 175.6805, 2009/04/17 12:17:42.6, 5, 1.33
3077469, -39.0157, 175.6738, 2009/04/18 09:54:16.3, 5, 1.045
3086002, -39.0417, 175.7278, 2009/05/04 17:08:15.2, 5, 1.709


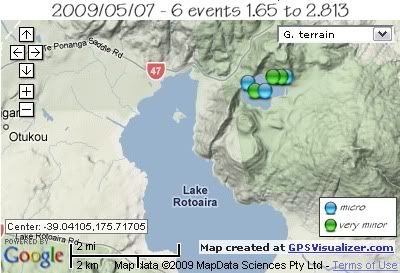
A small swarm occurred on 7th May at the north end of Lake Rotopounamu, 6 events over a period of 23 minutes
3087306, -39.0264, 175.7355, 2009/05/07 06:00:44.9, 2, 2.813
3094824, -39.0243, 175.7333, 2009/05/07 06:01:56.8, 2, 1.683
3087309, -39.0225, 175.7461, 2009/05/07 06:04:44.0, 5, 1.825
3087312, -39.0226, 175.7445, 2009/05/07 06:11:27.7, 5, 2.173
3087313, -39.0226, 175.7417, 2009/05/07 06:15:23.4, 2, 2.304
3087318, -39.0265, 175.7392, 2009/05/07 06:23:02.6, 2, 1.65

 Lake Rotopounamu quakes May 7th 2009

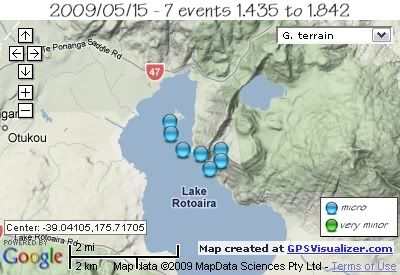
A small swarm occurred on the 15th May, starting with 4 initial micro quakes within a period of 6 minutes, starting from the south west corner of Motuopuhi Island and looping south and eastwards towards the south western flanks of Onepoto Craters, with 3 further events 4 hours later centred around where the Onepoto stream enters Lake Rotoaira.
3091788, -39.0343, 175.7066, 2009/05/15 16:16:54.4, 5, 1.435
3091789, -39.0375, 175.7071, 2009/05/15 16:18:19.5, 8, 1.739
3097688, -39.0418, 175.7112, 2009/05/15 16:22:36.5, 5, 1.498
3091791, -39.0449, 175.7242, 2009/05/15 16:23:05.5, 5, 1.883
3091881, -39.047, 175.7206, 2009/05/15 20:05:27.7, 7, 1.868
3091886, -39.043, 175.7175, 2009/05/15 20:15:37.6, 7, 1.807
3091906, -39.0419, 175.7243, 2009/05/15 21:11:06.6, 6, 1.842

Lake Rotoaira quakes 15th May 2009

3093372, -39.0392, 175.7184, 2009/05/18 09:46:44.1, 5, 1.488
3093374, -39.0426, 175.719, 2009/05/18 09:53:55.2, 5, 1.243
3094956, -39.0308, 175.7178, 2009/05/21 05:44:25.8, 8, 2.398
3094962, -39.0249, 175.6997, 2009/05/21 05:51:23.1, 8, 1.976


data by geonet. map by google maps. plots by highace using GPS Visualizer

Tuesday

2008 Lake Rotoaira quakes

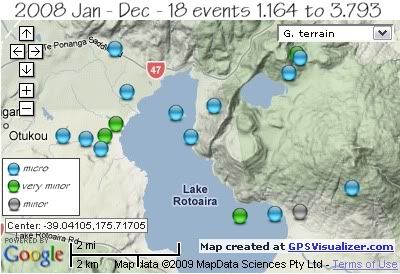
In 2008 there were only 18 earthquake events in the Lake Rotoaira/Rotopounamu area, with just one swarm of 5 micro events. One quake of note, because of it’s depth and magnitude was the 3.793 ML at 116 km deep on the 19th March. The epic-center was located below the south west corner of Mt Pihanga (shown on map as a grey orb)

 total 18 quakes Rotoaira/Rotopounamu area 2008

REF, LAT, LONG, TIME, DEPTH, MAG
2855717, -39.0594, 175.7424, 2008/01/25 09:26:22.1, 11, 1.648
2858224, -39.0524, 175.7687, 2008/01/30 18:50:12.3, 3, 1.837
2867955, -39.0446, 175.7893, 2008/02/19 22:50:23.9, 8, 2.223
2881694, -39.06, 175.7303, 2008/03/18 20:11:11.8, 5, 2.385
2881696, -39.039, 175.7137, 2008/03/18 20:15:20.0, 9, 1.238
2881772, -39.059, 175.7511, 2008/03/19 00:27:19.0, 116, 3.793
2910975, -39.027, 175.6918, 2008/05/20 03:55:03.7, 5, 1.587
2935261, -39.0169, 175.7499, 2008/07/08 18:37:48.7, 6, 2.134
2952936, -39.0218, 175.7474, 2008/08/13 14:58:39.0, 5, 1.324
2953770, -39.0179, 175.7509, 2008/08/15 03:03:20.5, 8, 1.933


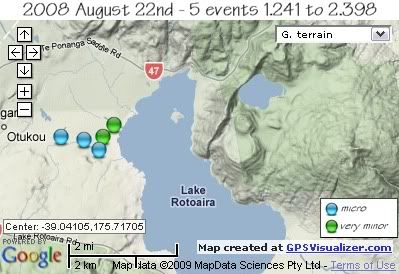
A short 16hr 5 event swarm on the 22nd August, located between the Wairehu Canal and the Mangatipua Stream in the low laying swampland, north east corner of Lake Rotoaira
2957102, -39.0387, 175.6697, 2008/08/22 01:41:48.1, 5, 1.462
2957115, -39.0385, 175.684, 2008/08/22 02:10:32.4, 5, 2.398
2957255, -39.0421, 175.6828, 2008/08/22 07:12:13.0, 5, 1.914
2957361, -39.0355, 175.688, 2008/08/22 11:56:10.9, 5, 2.011
2962597, -39.0394, 175.6776, 2008/08/22 17:50:10.5, 5, 1.241


 Wairehu Canal area quakes August 22nd 2009

2975137, -39.0154, 175.6876, 2008/09/27 02:41:52.9, 7, 1.623
2979358, -39.0325, 175.7084, 2008/10/05 12:54:11.6, 5, 1.418
3012500, -39.0308, 175.7215, 2008/12/09 18:00:44.9, 5, 1.164


data by geonet. map by google maps. plots by highace using GPS Visualizer

Monday

2007 Rotoaira/Rotopounamu quakes

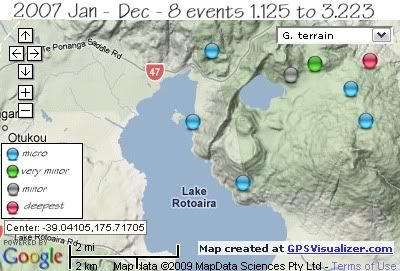
2007 was a another quiet year in the Rotoaira/Rotopounamu area with only 8 earthquakes and no swarms. The deepest quake was the 2.682 ML event of April 1st at 95km deep. (shown on map as a magenta coloured orb)

 total 8 quakes Rotoaira/Rotopounamu area 2007

REF, LAT, LONG, TIME, DEPTH, MAG
2712952, -39.0155, 175.7212, 2007/03/20 14:36:55.1, 5, 1.125
2720345, -39.0256, 175.769, 2007/04/05 06:40:34.5, 5, 1.515
2798743, -39.0342, 175.7742, 2007/09/24 23:27:10.8, 8, 1.517
2842123, -39.0506, 175.7317, 2007/12/26 10:33:22.9, 6, 1.525
2717090, -39.0345, 175.7145, 2007/03/29 03:38:12.4, 9, 1.795
2712064, -39.0188, 175.7564, 2007/03/18 18:59:49.2, 5, 2.035
2718780, -39.0182, 175.7755, 2007/04/01 19:18:02.4, 95, 2.682
2827052, -39.022, 175.7485, 2007/11/24 21:31:36.1, 12, 3.223


data by geonet. map by google maps. plots by highace using GPS Visualizer