Saturday

Mt. Tihia/Tokaanu Introduction

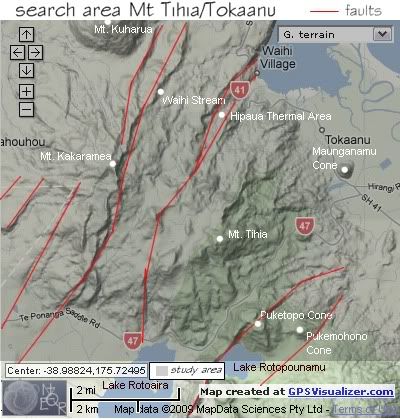
The parameters of Latitude and Longitude that have been used in this research/study have been set by the recent earthquake swarm of events in the area starting June 26th. 2009. These events followed on from activity during the previous month to the south at Lakes Rotoaira & Lake Rotopounamu.
They are Northern Latitude –38.945 (-38° 56' 42" S), Southern Latitude -39.015 (-39° 0' 54"), Western Latitude 175.66 (175° 39' 35.9994" E), Eastern Latitude 175.79 (175° 47' 23.9994" E).
The maps below show the search areas as a darker shade.
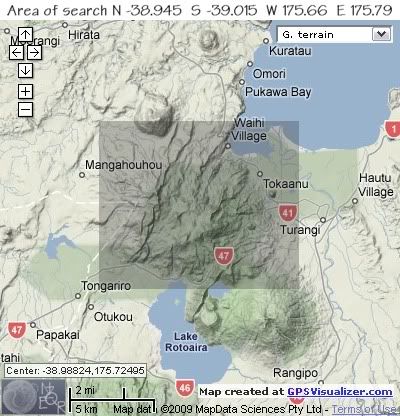
 area of search

 area of search with geographical tags

Geology
The Taupo Volcanic Zone lies above the sub-ducting Pacific Plate and is crossed by NE-NW trending faults of the Taupo Graben
Andesite magma occasionally wells up through some of these faults, resulting in chains of volcanic features parallel to the boundry plate.
An exception to the general trend are three old cones north of Lake Rotoaira; Mt. Pihanga, Mt. Tihia and Mt Kakaramea.
These 3 volcanoes relate to a pre-Taupo Graben plate boundry and associated faults which lay at right angles .( NW-SE)to the current ones (NE-SW)
The north-westerly trending Kakaramea-Tihia Massif and Pihanga form a chain of volcanoes which last erupted more than 20,000 years ago, but from which large mudflows have recurred up to as recently as 1910 A.D.

Of the other cones or domes in the area geologigal studies have shown that Papanetu Tephra was erupted from the site of Kuharua Dome c. 9,785 years ago towards the end of dome formation. Manganamu Dome is younger than 1819 years old.

Tokaanu–Waihi geothermal field is situated near the southern end of the Taupo Volcanic Zone. Neutral chloride thermal waters discharge at Tokaanu and Waihi in the north of the field on flat land between the andesite volcanoes Tihia and Kakaramea and the shore of Lake Taupo, while steam-heated thermal features occur at Hipaua on the northern flanks of Kakaramea. Electrical resistivity surveys have shown that Tokaanu, Waihi and Hipaua all lie within a continuous region of low apparent resistivity (5–20 Ωm) and are thus part of the same geothermal system. Interpretation of the resistivity and other data suggests that the Tokaanu–Waihi thermal waters rise nearly vertically from a source deep beneath the elevated southwestern part of the field to the water table. These waters then flow north to discharge at the surface near Lake Taupo. Neighbouring geothermal systems, which occur at Tongariro about 18 km south of Tokaanu–Waihi, and at Motuoapa about 10 km to the northeast, are separated from the Tokaanu–Waihi field by high resistivity ground. This suggests that the thermal fluids discharging at the three fields do not have a common source, as has been suggested previously.
The steaming ground area Hipaua is the 3rd largest of its kind in the TVZ and covers approx.1km2 of steep ground along the Waihi Fault.

Event Recording
Early earthquake activity in the southern Taupo Volcanic Zone was recorded with the national seismic network, then more so from 1966 onwards when a seismometer near Mt Ruapehu was incorporated in the network. The detectable number of swarms increased significantly when, in 1985, a sub-network around Lake Taupo was installed - the Taupo Network, which recorded events with a magnitude less than 2 ML. Prior to 1985, only events with ML greater than 3.0 had been recorded.
The Taupo Seismic Network was a network of six telemetred seismographs that operated around Lake Taupo between 1985 September and 1991 July.
The stations were;
KETZ at Ketetahi
RATZ at Rangitukua
HITZ at Hingarae
HATZ at Hinemaiaia
TUTZ at Tuhingamata
HUTZ at Hika Falls
They are now integrated into the WELT Network run by the Institute of Geological and Nuclear Sciences.
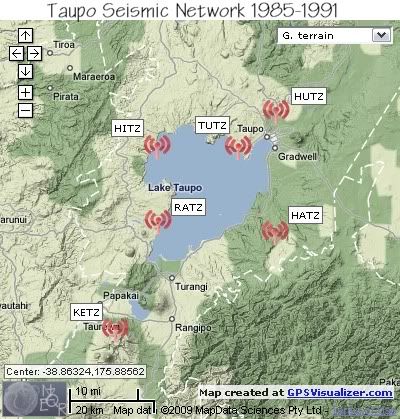
 taupo seismic network stations 1985 - 1991

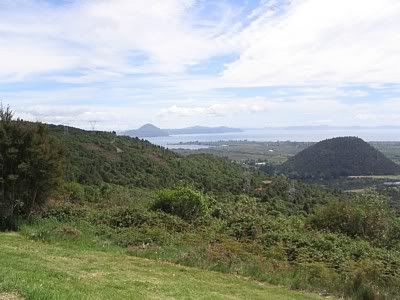
 view from Mt. Tihia north, Maunganamu Cone to the right, photoby Peter Thomson

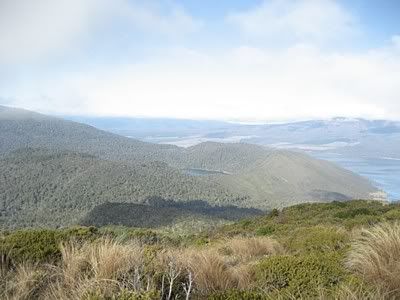
 view from Mt. Tihia south, Lake Rotopounamu in the center and Lake Rotoaira to the right

2010 November 25th Mt. Tihia Swarm

Small swarm of 10 earthquakes beneath the northern slopes of Mt. Tihia on the 25th November 2010 UTC ( evening of the 25th and morning of the 26th November 2010 NZDT)

REF, LAT, LONG, TIME UTC, DEPTH, MAG
3412460, -38.9762, 175.7372, 2010/11/25 4:1:22, 5, 1.953
3412468, -38.97015, 175.75049, 2010/11/25 4:24:47, 9, 1.841
3412471, -38.9809, 175.75713, 2010/11/25 4:30:11, 5, 2.455
3412558, -38.97807, 175.74948, 2010/11/25 8:36:29, 6, 1.701
3412612, -38.97266, 175.7431, 2010/11/25 10:43:49, 5, 2.461
3412621, -38.98363, 175.75374, 2010/11/25 11:6:12, 5, 2.266
3412635, -38.98073, 175.74208, 2010/11/25 11:35:11, 5, 2.458
3412660, -38.97491, 175.75343, 2010/11/25 12:27:35, 4, 2,0
3412669, -38.97989, 175.74858, 2010/11/25 12:52:9, 5, 2.362
3412755, -38.98271, 175.7352, 2010/11/25 17:4:9, 8, 1.883


View Larger Map

Tuesday

Okataina Volcanic Center July 24-31 2010

A swarm of earthquakes at Okataina Volcanic Center started on the 24th July 2010. The trend of the swarm is in a south west to north east direction between Te Horoa Dome in the south and Rotokohu Dome in the north and generally confined between Lake Okataina in the west and the Tarawera River in the east.
The swarm has seen two sets of multiple events, the first on 24th July of 29 quakes, with the main cluster located between Tuahu and Makatiti Domes, and other individual events running in a line SW to NE.

REF, LAT, LONG, TIME UTC, DEPTH, MAG
3344344, -38.13547, 176.4568, 2010/7/24 3:16:55, 3, 1.858
3344356, -38.1246, 176.47528, 2010/7/24 3:47:19, 3, 2.14
3344368, -38.13937, 176.44946, 2010/7/24 4:18:37, 3, 1.556
3344374, -38.07297, 176.36667, 2010/7/24 4:35:19, 6, 2.041
3344376, -38.13751, 176.50975, 2010/7/24 4:41:24, 4, 1.636
3344377, -38.11678, 176.47783, 2010/7/24 4:44:51, 2, 1.431
3344378, -38.12024, 176.47536, 2010/7/24 4:47:32, 3, 1.693
3344387, -38.13157, 176.48073, 2010/7/24 5:10:52, 2, 2.727
3344396, -38.11113, 176.48688, 2010/7/24 5:30:33, 5, 2.328
3344397, -38.12171, 176.46812, 2010/7/24 5:32:38, 5, 2.087
3344400, -38.12833, 176.47604, 2010/7/24 5:38:52, 4, 2.112
3344405, -38.10339, 176.41908, 2010/7/24 5:51:50, 5, 2.348
3344409, -38.13679, 176.45316, 2010/7/24 5:59:33, 5, 1.832
3344410, -38.16638, 176.41478, 2010/7/24 6:1:16, 0, 1.898
3344414, -38.14753, 176.42143, 2010/7/24 6:9:49, 0, 2.798
3344416, -38.15747, 176.42912, 2010/7/24 6:15:5, 0, 2.326
3344428, -38.13134, 176.48671, 2010/7/24 6:38:34, 4, 2.281
3344433, -38.13679, 176.53227, 2010/7/24 6:51:38, 0, 2.524
3344434, -38.15676, 176.42847, 2010/7/24 6:54:43, 0, 1.779
3344444, -38.14668, 176.43973, 2010/7/24 7:17:3, 3, 1.26
3344445, -38.15165, 176.40613, 2010/7/24 7:20:12, 1, 1.656
3344446, -38.12308, 176.47493, 2010/7/24 7:23:54, 4, 2.081
3344450, -38.12133, 176.47269, 2010/7/24 7:28:47, 5, 1.878
3344452, -38.13005, 176.48242, 2010/7/24 7:32:40, 5, 2.589
3344467, -38.13332, 176.47977, 2010/7/24 8:6:37, 4, 2.362
3344504, -38.12964, 176.47934, 2010/7/24 9:40:36, 4, 2.075
3344508, -38.1288, 176.46902, 2010/7/24 9:51:47, 5, 2.575
3344533, -38.12283, 176.48033, 2010/7/24 10:57:11, 4, 2.185
3349176, -38.12968, 176.46437, 2010/7/24 3:47:56, 3, 1.508
3349125, -38.11595, 176.48152, 2010/7/25 5:38:60, 5, 2.262
3345240, -38.12609, 176.4762, 2010/7/25 19:48:6, 4, 2.36

The 2nd cluster on the 27th July of 24 quakes, with 2 larger magnitude quakes, was located more to the north east of Makatiti Dome.
REF, LAT, LONG, TIME UTC, DEPTH, MAG
3345540, -38.11116, 176.45203, 2010/7/26 10:32:40, 4, 1.843
3347485, -38.12217, 176.45259, 2010/7/27 18:26:13, 5, 1.735
3346280, -38.13248, 176.47916, 2010/7/27 18:36:47, 2, 2.304
3346287, -38.13969, 176.50003, 2010/7/27 18:56:4, 4, 2.249
3346297, -38.14746, 176.48602, 2010/7/27 19:20:26, 6, 1.994
3346300, -38.13341, 176.47839, 2010/7/27 19:25:29, 2, 2.604
3346306, -38.14052, 176.48219, 2010/7/27 19:39:57, 5, 2.383
3346308, -38.10266, 176.5273, 2010/7/27 19:46:26, 0, 1.976
3346310, -38.16275, 176.49199, 2010/7/27 19:53:3, 7, 3.203
3346312, -38.07795, 176.459, 2010/7/27 19:57:50, 5, 2.55
3346314, -38.13774, 176.49301, 2010/7/27 20:2:20, 2, 2.904
3346315, -38.14906, 176.49643, 2010/7/27 20:6:19, 4, 2.344
3346318, -38.1297, 176.4666, 2010/7/27 20:15:52, 6, 2.389
3346321, -38.14143, 176.47681, 2010/7/27 20:23:24, 5, 2.731
3346323, -38.08115, 176.53175, 2010/7/27 20:26:7, 5, 2.233
3346327, -38.12216, 176.52818, 2010/7/27 20:33:20, 1, 2.302
3346329, -38.14401, 176.44679, 2010/7/27 20:41:26, 2, 2.214
3346330, -38.13774, 176.45572, 2010/7/27 20:46:15, 3, 0.936
3346331, -38.13833, 176.42574, 2010/7/27 20:50:16, 5, 1.797
3346333, -38.13763, 176.47778, 2010/7/27 20:52:44, 0, 2.304
3346336, -38.09967, 176.50217, 2010/7/27 20:59:25, 5, 2.463
3346344, -38.10514, 176.48947, 2010/7/27 21:19:11, 10, 3.059
3346346, -38.12784, 176.46614, 2010/7/27 21:24:28, 7, 2.288
3346354, -38.12487, 176.47263, 2010/7/27 21:45:54, 5, 2.431
3346379, -38.14181, 176.47382, 2010/7/27 22:56:11, 5, 2.712

Further quakes since;
REF, LAT, LONG, TIME UTC, DEPTH, MAG
3346733, -38.16077, 176.4682, 2010/7/28 14:3:39, 2, 2.346
3346798, -38.13232, 176.47098, 2010/7/28 16:32:49, 5, 2.51
3347356, -38.16036, 176.46663, 2010/7/29 16:40:5, 7, 2.072
3347381, -38.15456, 176.44786, 2010/7/29 17:56:57, 4, 2.131
3347400, -38.15641, 176.45714, 2010/7/29 18:49:22, 5, 2.71
3347478, -38.15719, 176.43483, 2010/7/29 19:39:58, 4, 2.44
3347836, -38.1613, 176.46107, 2010/7/30 14:15:16, 5, 2.415
3348434, -38.15256, 176.47557, 2010/7/31 18:14:48, 2, 2.607
3348436, -38.15586, 176.45097, 2010/7/31 18:19:20, 5, 1.902
3348437, -38.1456, 176.47241, 2010/7/31 18:20:47, 2, 2.621


View Larger Map

Saturday

Cape Egmont Swarm June 2010

Over the week of 4th – 11th June 2010 a series of 9 earthquakes occurred west of Mt. Taranaki in the area known as the Cape Egmont Fault Zone.
The initial quake appears to be a double quake with the same time reading, but 2.13km apart. The 3.572ML event was reported MM4 (largely observed) at Pungarehu [1], Rahotu [1] and Warea [1].
REF, LAT, LONG, TIME UTC, DEPTH, MAG
3317910, -39.26843, 173.76195, 2010/6/4 15:36:19.5, 15, 3.572
3318090, -39.27583, 173.78476, 2010/6/4 15:36:19.5, 16, 3.627
3320356, -39.27594, 173.80382, 2010/6/9 4:4:28.9, 12, 2.906
3320495, -39.28713, 173.89268, 2010/6/9 10:52:20.9, 19, 1.754
3320667, -39.31802, 173.64392, 2010/6/9 20:12:11.7, 10, 2.724
3320674, -39.29044, 173.80011, 2010/6/9 10:54:16.3, 15, 1.467
3320860, -39.30838, 173.67719, 2010/6/10 6:1:59.4, 8, 3.144
3321217, -39.26763, 173.7896, 2010/6/10 21:24:45.4, 12, 2.768
3321372, -39.27642, 173.81067, 2010/6/11 4:25:55.5, 15, 2.711

A moderate 5.318ML earthquake occurred on Saturday, June 12 2010 at 2:20 am NZST 100km to the south and was reported widely felt throughout the lower North Island and upper South Island. It is unclear if this larger event is related to the Cape Egmont swarm as the faults south of the Cape Egmont Fault Zone in the South Taranaki Bight have yet to be determined west of the Manaia Fault.
3321605, -40.20919, 173.5623, 2010/6/11 14:20:12.6, 166, 5.318
The larger event is shown on the map for reference (zoom out)


View Larger Map

data by geonet. map by google maps. plots by highace using GPS Visualizer

Cape Egmont earthquake events 2009

The map below shows earthquake events in the Cape Egmont Fault Zone for the period Jan 1st to Dec 31st 2009. 226 earthquakes 0.849ML to 3.846ML

The following events were reported as Felt.
REF, LAT, LONG, TIME UTC, DEPTH, MAG
3027526, -39.10921, 173.63722, 2009/1/9 1:52:12.6, 14, 3.729
3033196, -39.31374, 173.50322, 2009/1/20 9:22:37.3, 5, 3.846
3091166, -39.08566, 173.89745, 2009/5/14 15:14:22.5, 9, 2.915
3106367, -39.25883, 173.7386, 2009/6/11 6:59:28.7, 8, 3.408
3138746, -39.17786, 173.53648, 2009/8/14 0:14:19.3, 12, 3.451
3175587, -39.01117, 174.0569, 2009/10/29 5:22:53.9, 13, 3.202


View Larger Map

Cape Egmont earthquake events 2008

The map below shows earthquake events in the Cape Egmont Fault Zone for the period Jan 1st to Dec 31st 2008. 156 earthquakes 0.915ML to 3.433ML

Only two events were reported as Felt, both on the 5th May UTC.
REF, LAT, LONG, TIME UTC, MAG, DEPTH
2904265, -39.051, 174.0005, 2008/05/05, 14:16:40.9, 1.806, 5
2904348, -39.2413, 173.8066, 2008/05/05 19:00:18.9, 2.084, 28


View Larger Map

Cape Egmont Mag 3+ Events Jan 2000- June 3rd 2010

The events shown in the map below are for magnitude 3.0+ ML for the period Jan1 2000 to June 3rd 2010. Some events were Felt, they are marked on the popup tags on each event.


View Larger Map

data by geonet. map by google maps. plots by highace using GPS Visualizer